Matlab is a powerful numerical environment in which to analyze data and compute numerically. It also has hooks into the symbolic computation engine of Maple, but its real strength is in matrix calculations. In essence, Matlab wants to think of everything as a two-dimensional matrix (a habit of mind I frankly still find rather awkward at times).
Matlab's graphics defaults are unsuitable for publications and one must take some care to alter the default values (the text size, in particular) to produce acceptable results.
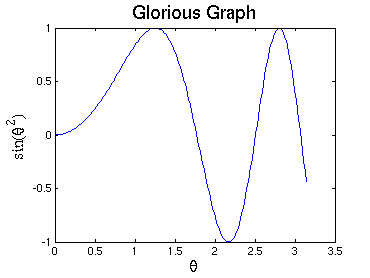
As an example, let's plot the sine of θ2 between zero and π.
xv = linspace( 0, pi, 200 );	% make a vector of 200 x values
yv = sin( xv .* xv );           % compute the corresponding y values
plot( xv, yv );                 % generate the plot
xlabel( '\it{\theta}', 'FontName', 'Times', 'FontSize', 16 );
ylabel( 'sin(\it{\theta}^{2})', 'FontName', 'Times', 'FontSize', 16 );
title( 'Glorious Graph', 'FontName', 'Helvetica', 'FontSize', 18 );
This result looks like this:
Unfortunately, on my system Matlab doesn't seem to understand how to italicize Greek letters properly (help!) and the numeric labels are too small.
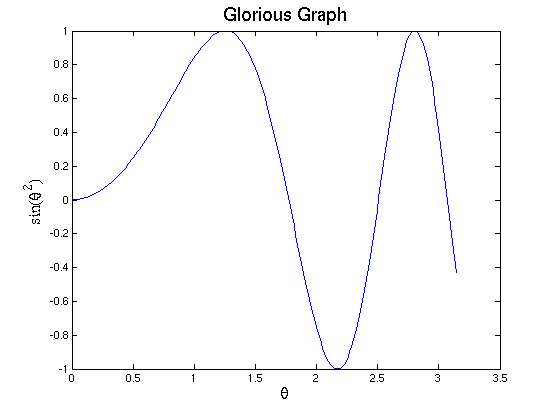
To fix the axis tick font size problem, and to export in either PDF format or EPS format, for inclusion in LaTeX, select File | Export Setup... from the menu bar in the graph's window. Then play around with the options. If you change the exported graph's width to 5 inches and height to 3.75 inches, the default font size is not too bad. Click on the Apply to Figure button and preview the results. When you are satisfied with the appearance of the graph, click on the Export... button and select the graphic format you wish. For inclusion in printed work or PDF documents, use a vector graphics format (e.g., EPS or PDF); for web use, aim for a lossless bitmap format. JPEG might work, but it usually gives annoying ghosts around features of sharp contrast (lines), which appear throughout graphs.